https://www.ngdc.noaa.gov/mgg/topo/globe.html
https://www.ngdc.noaa.gov/mgg/topo/report/globedocumentationmanual.pdf
Elevation Code: elevations.py
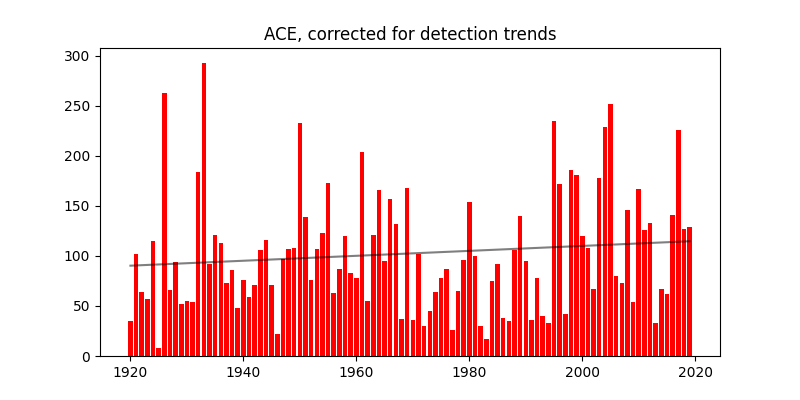
This analysis calculates ACE and corrects for linear trends in tropical storm and hurricane detection. Of course the detection of tropical storms and hurricanes has not changed linearly, but 100 years of near-land storm detection shows about a 7% increase to a 23% decrease in the percent of storms near land. Using the linear correction is probably adequate for the oldest data and some newer data as satellite-based detection is still improving.
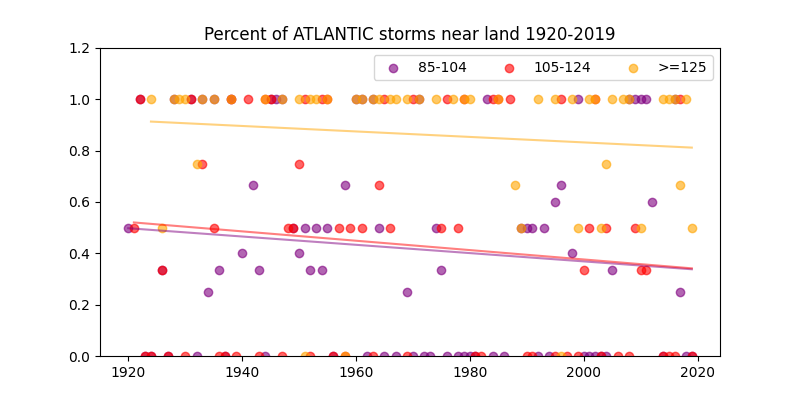
The storms near land (versus storms not near land) should be constant. There's no physical reason for storm tracks to change from nearing land to not nearing land over the past 100 years. But there is a reasonable likelihood that storms near land were easier to detect 100 years ago, whereas storms over the open ocean are now equally easy to detect.
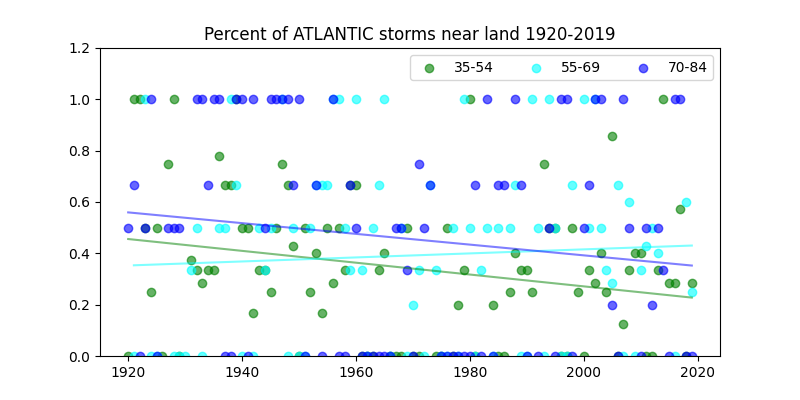
However, the change is different for different storm strengths:
| Min speed (knots) | Max speed (knots) | Trend per year |
|---|---|---|
| 35 | 54 | -0.00230 |
| 55 | 69 | 0.000785 |
| 70 | 84 | -0.00209 |
| 85 | 104 | -0.001615 |
| 105 | 124 | -0.001824 |
| 125 | and up | -0.001067 |
ACE is calculated by adding the square of the wind speed of each storm or hurricane at 6 hour intervals. The total is divided by 10,000 to normalize the number. ACE is added up separately for each category of storm listed in the table above. The ACE for the year is adjusted by multiplying by: (1 - (trend * (YEARS[1] - current_year))) YEARS[1] for the charts below is 2019. For the strongest storms >= 125 knots, the oldest ACE numbers are adjusted up about 10% of the calculated ACE due to the annual detection trend of -0.001067
The corrected record shows an linear trend in ACE over the past century of roughly .25 per year or an ACE increase of 25 over the past 100 years
There are some caveats which are mainly due to binning. In many years there are only a few storms in each category. That shows up in the detection trend plots as points clustered at 0%, 50%, and 100% That is somewhat compensated by trending all 100 years. The other result of binning is numerous past years are not adjusted for some categories. For example if there were zero very strong storms, there will still be zero very strong storms after adjustment.
Code: ace-adjusted.py | Data: hurdat.csv | Instructions: README
 |
|