https://www.ngdc.noaa.gov/mgg/topo/globe.html
https://www.ngdc.noaa.gov/mgg/topo/report/globedocumentationmanual.pdf
Elevation Code: elevations.py
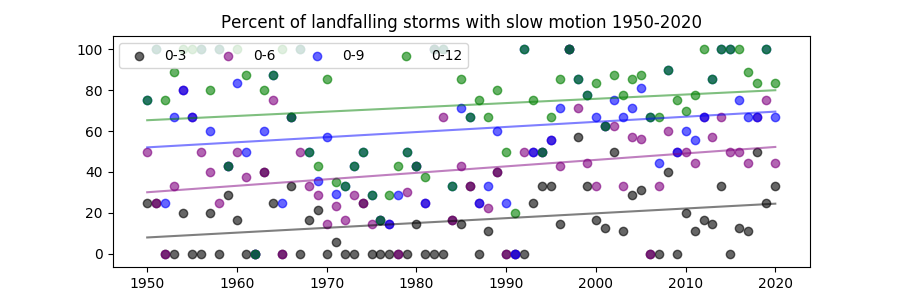
This analysis counts landfalling hurricanes and calculates their slowest six hour movement within a 36 hour period before and after landfall. Then divides the number of slow moving landfalling storms by the total landfalling storms (slow or not).
The analysis now tracks all landfalls. Claudette made two landfalls and the second one was slow with the US 24 hour rainfall record. Mitch had three landfalls, the first of which was slow and deadly. Dorian had one landfall with only one data point (7 meters). There will be missed storms that move slowly past smaller islands due to the limitations of using 6 hour positions only (for long term consistency).
The analysis shows storms that that stall or do very small loops like Harvey (2017) and Florence (2018) are relatively rare events with some natural variation. But storms like most recently Imelda (2019) are increasing by percentage, and as the Post article for Imelda points out, there's more moisture to work with leading to higher rainfall totals. These storms can move slowly 4-6 mph without stalling but still dump more rainfall like Imelda without even becoming hurricanes.
The trend since 1950 in landfalling storms moving 6 mph or less is 0.157 percent per year. Using that trend for 70 years gives an 11 percentage point rise. In other words the percentage of landfalling storms <= 6 mph has risen from about 40% in 1950 to 50% today. With the increase in available moisture, it's no suprise that 6 of the 10 wettest US storms have occurred since 1997. However they remain relatively rare especially the stalled storm events, <= 3 mph.
Here's a list of the slowest moving landfalling storms since 1950 that moved 6 mph or less for 6 hours, except Amelia 1978 as noted. The highlighted storms moved 3 mph or less for 6 hours. Ranking US wettest column is from Wettest storms in the US (Wikipedia)
(Note: auto-generated table is under construction)
| Year | Name | speed mph | rank US | Rain 24 hr | Rain total | Notes |
|---|---|---|---|---|---|---|
| 1992 | DANIELLE | 5.29 | ||||
| 1993 | ARLENE | 1.02 | ||||
| GERT | 3.97 | |||||
| 1994 | ALBERTO | 1.5 | 27.85 | GA state record | ||
| BERYL | 1.52 | |||||
| GORDON | 3.61 | |||||
| 1995 | DEAN | 0.0 | ||||
| ERIN | 1.02 | |||||
| JERRY | 3.8 | |||||
| OPAL | 1.15 | |||||
| ROXANNE | 3.2 | |||||
| 1996 | DOLLY | 5.87 | ||||
| FRAN | 2.3 | |||||
| HORTENSE | 4.43 | |||||
| 1997 | DANNY | 1.52 | 8 | 32.52 | 36.71 | AL state record |
| 1998 | BONNIE | 5.96 | ||||
| FRANCES | 2.3 | |||||
| GEORGES | 0.99 | 7 | 38.46 | FL/MS MS state record (32.21) | ||
| HERMINE | 2.3 | |||||
| MITCH | 0.0 | 62.87 | Honduras, Nicaragua 11,000 fatalities | |||
| 1999 | BRET | 5.26 | ||||
| DENNIS | 2.25 | |||||
| FLOYD | 1.15 | |||||
| LENNY | 1.59 | |||||
| 2000 | GORDON | 4.73 | ||||
| KEITH | 1.1 | 32.67 | Belize record | |||
| 2001 | ALLISON | 1.15 | 6 | LA 2nd highest | ||
| BARRY | 5.76 | |||||
| CHANTAL | 4.53 | |||||
| GABRIELLE | 4.16 | |||||
| MICHELLE | 4.1 | |||||
| 2002 | BERTHA | 2.51 | ||||
| EDOUARD | 1.0 | |||||
| FAY | 2.3 | |||||
| HANNA | 3.46 | |||||
| ISIDORE | 2.54 | |||||
| 2003 | BILL | 3.62 | ||||
| HENRI | 3.07 | |||||
| LARRY | 1.15 | |||||
| 2004 | FRANCES | 3.85 | ||||
| GASTON | 2.95 | |||||
| IVAN | 2.3 | |||||
| JEANNE | 4.9 | |||||
| 2005 | ARLENE | 5.86 | ||||
| BRET | 5.54 | |||||
| DENNIS | 0.89 | 42.99 | Cuba 2nd highest | |||
| EMILY | 1.08 | |||||
| JOSE | 5.9 | |||||
| STAN | 5.88 | |||||
| WILMA | 2.54 | 64.33 | record 24h Western Hemisphere | |||
| BETA | 2.52 | |||||
| GAMMA | 1.15 | |||||
| 2007 | HUMBERTO | 5.85 | ||||
| LORENZO | 3.97 | |||||
| NOEL | 4.06 | 29.43 | Bahamas record | |||
| 2008 | ARTHUR | 4.52 | ||||
| DOLLY | 0.0 | |||||
| FAY | 0.0 | |||||
| GUSTAV | 1.5 | |||||
| HANNA | 3.16 | |||||
| PALOMA | 1.57 | |||||
| 2009 | ERIKA | 3.32 | ||||
| IDA | 4.12 | |||||
| 2010 | ALEX | 3.62 | ||||
| HERMINE | 5.76 | |||||
| KARL | 2.18 | |||||
| PAULA | 5.08 | |||||
| RICHARD | 1.1 | |||||
| 2011 | ARLENE | 3.21 | ||||
| LEE | 1.15 | |||||
| NATE | 4.33 | |||||
| RINA | 5.1 | |||||
| 2012 | BERYL | 2.29 | ||||
| DEBBY | 3.02 | |||||
| HELENE | 5.09 | |||||
| ISAAC | 4.58 | |||||
| 2013 | BARBARA | 1.6 | ||||
| ANDREA | 5.85 | |||||
| BARRY | 5.43 | |||||
| INGRID | 4.7 | |||||
| 2014 | GONZALO | 1.51 | ||||
| HANNA | 4.6 | |||||
| 2015 | ANA | 3.01 | ||||
| 2016 | BONNIE | 1.51 | ||||
| DANIELLE | 4.91 | |||||
| JULIA | 5.87 | |||||
| MATTHEW | 5.76 | |||||
| 2017 | HARVEY | 2.32 | 1 | 60.58 | TX TX and US record | |
| IRMA | 5.46 | |||||
| KATIA | 3.42 | |||||
| NATE | 5.67 | |||||
| 2018 | ALBERTO | 5.03 | ||||
| FLORENCE | 2.24 | 9 | 35.93 | NC/SC state records | ||
| GORDON | 2.49 | |||||
| KIRK | 1.12 | |||||
| 2019 | BARRY | 4.66 | AR state record (16.59) | |||
| DORIAN | 1.54 | 22.84 | Bahamas 2nd highest | |||
| IMELDA | 4.72 | 5 | ||||
| 2020 * | AMANDA:CRISTOBAL | 1.59 | ||||
| FAY | 0.0 | |||||
| KYLE | 4.46 | |||||
| SALLY | 2.51 | |||||
| BETA | 2.86 | |||||
| GAMMA | 1.15 | |||||
| ZETA | 5.13 | |||||
| ETA | 2.52 |
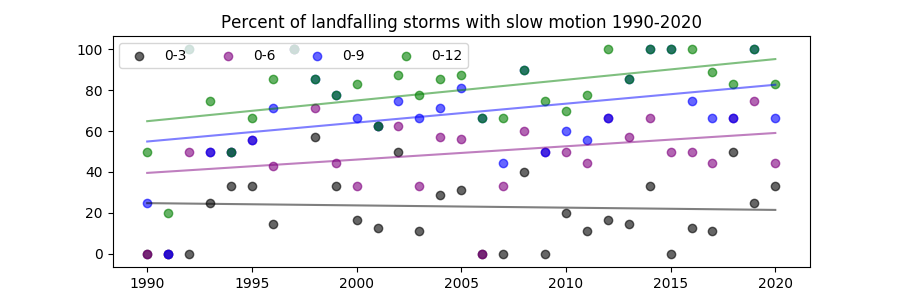
The analysis shows a long term trend towards slowing. The shorter term trends show the slowest or stalled storms as flat or varying as a larger number of those stalled patterns occurred in the 1990s and 2000s.
Code: hurricanes.py | Data: hurdat.csv | Instructions: README
| Trends in slowing for various periods |
|---|
|